Student Debt Analysis
Student Debt - Is it a Crisis?
As phrased by former Presidential Democrat candidates Bernie Sanders and Elizabeth Warren, rising student debt is a big problem in the U.S. Higher education is becoming more expensive - but one might doubt, is it really that alarming? Are returns to education decreasing? Does student debt take a larger portion of total debt?
To understand more about student debt crisis, I used Survey of Consumer Finances (the survey is conducted every three years from 1989, the most recent year is 2016) and created visualizations to understand more about the problem.
1. Proportion of Student Loan Debt to Other Debts
If student debt is a problem, then the proportion of student debt should have increased relative to total income. I also thought that it is important to see total debt to income ratio to understand how much debt people usually have on average. Below is a visualization of average household debt for that year. Bar graph shows total debt to income ratio. Line graph shows student loan to total income ratio.

This shows that after 2010, the rise in student loan debt respective to income has dramatically increased, where as general debt to income ratio has not changed much. This shows that student loan debt has increased more since 2010 - education is becoming more expensive as years pass by.
This graph shows overall trend in total debt and total student loan debts. It is good to get a summary picture of the changes in debt.
Then, seeing the summary visualization above, I wondered what is the proportion of student debt to other debts? This visualization below tells the story.

The above graph shows amount change in average loan amounts (by household) over the years. This graph expresses average household’s debt composition for each year. This graph shows that substantial amount of the debt are mostly mortgage. Student loan was not a noticeable part of debt composition back in 1989, but as time passes by, the student loan debt amount is growing, irrelevant of the changes in total debt average.
The two graphs both express that student loan debt is indeed increasing by the year for average households.
2. Does Higher Student Loan Amounts Contribute to Going Broke?
Student loan debt is increasing; then, do people go broke because of student loan debt? How critical is student loan debt?
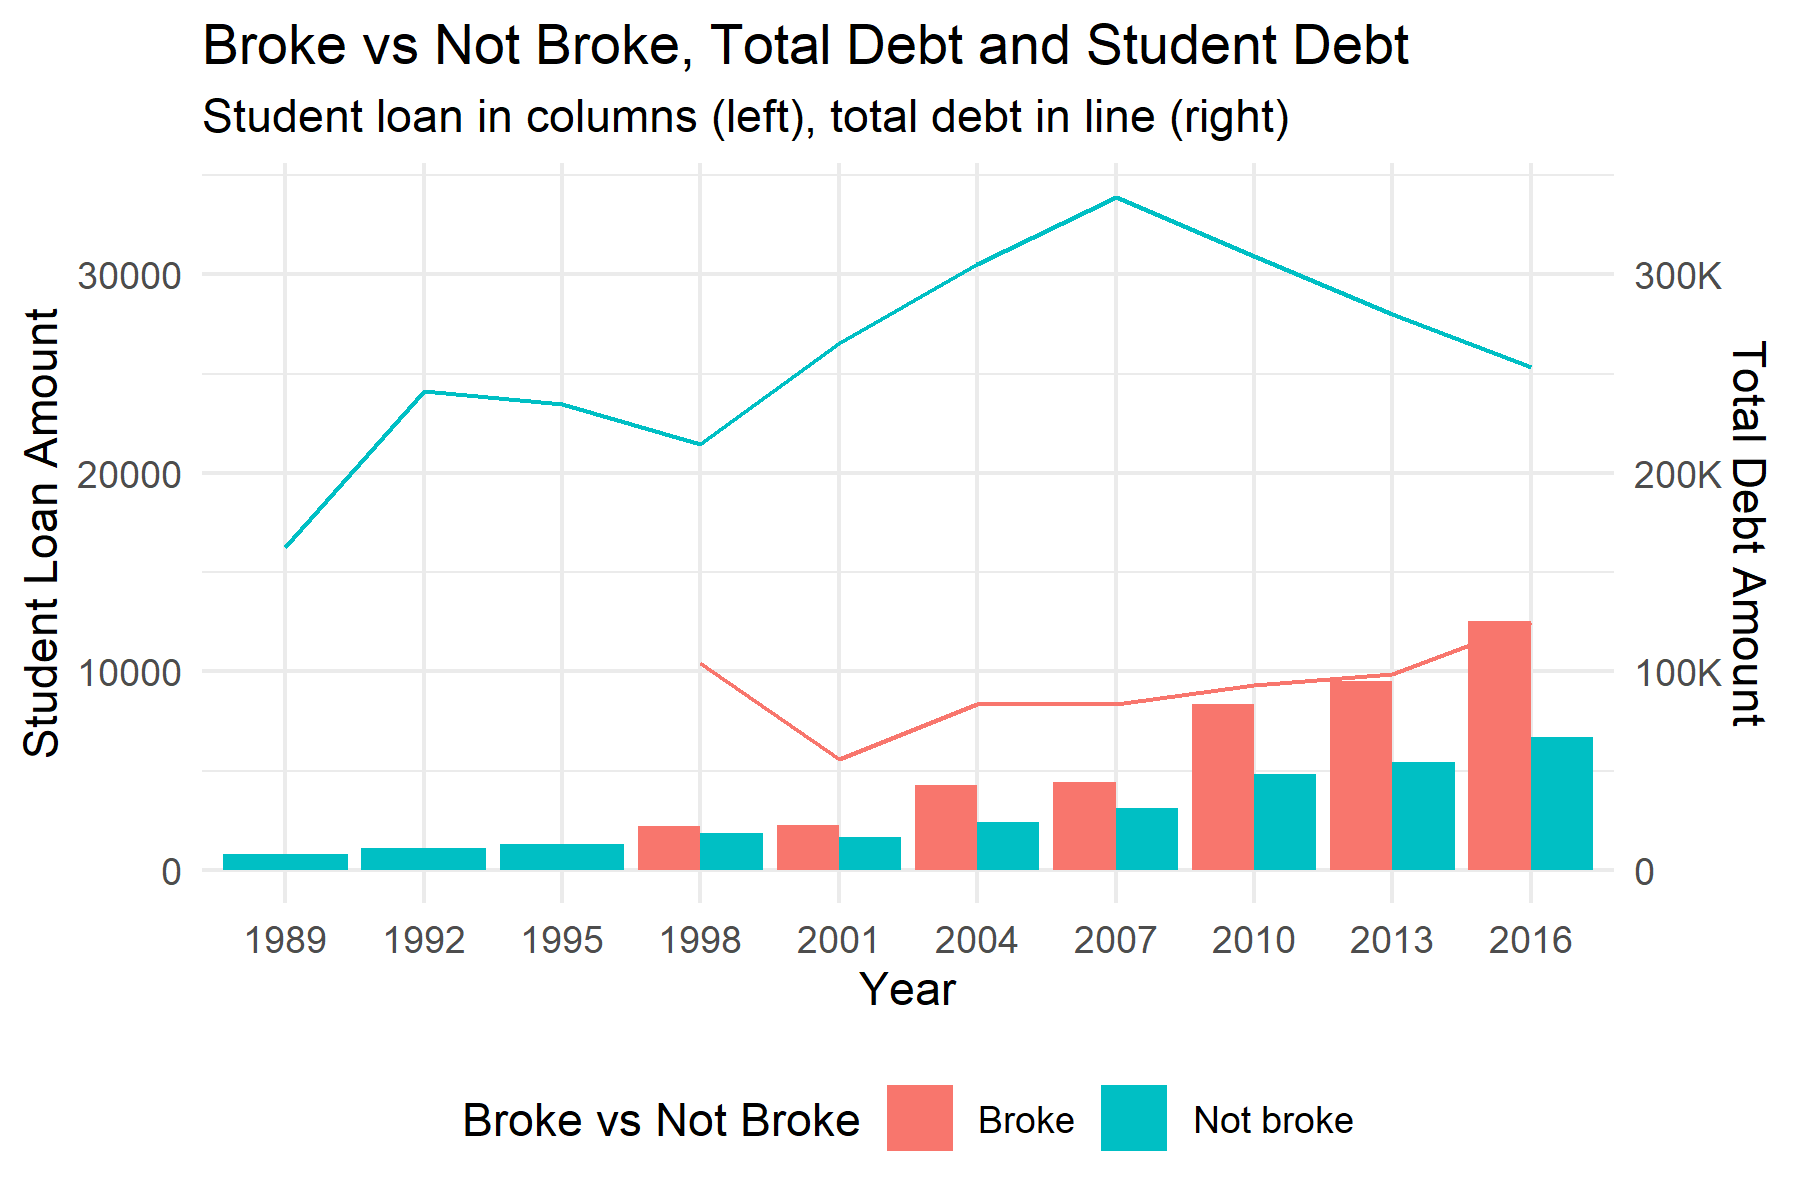
To understand this, I compared the broke and not broke population. The debt amount is average household debt amount for that year, for those who are broke and for those who are not broke.

Student loan amount is expressed in bar graph and total debt is expressed in line graph. The above visualization shows that for broke people, the student debt amount is actually greater than those who are not broke. Student loan debt plays a big part in them becoming broke. Also, as time pass by, broke people, on average, their student debt amount increases much steeper than those who are not broke.
I also made other visualizations to understand student loan debt, especially in the recent years.
3. Is Pursuit for Higher Education Driving Up the Student Loan Debt?
One thing to consider is that more people receive higher education (higher education here means all education beyond high school education).
To explore more into this question, I visualized average student loan debt by educational levels - but added more story by looking at one’s wealth status (net worth percentile) and race (non-Hispanic white, black, Hispanic and other). I only used the most recent data (2016 results).

The above visualization expresses average student debt amount for one’s educational level. As expected, in general, doctorate or professional degree holders have more student loan debt on average. However, in the case of Hispanic and other races, those with master’s degree actually has more debt than those with PhD. For most races, regardless of his/her educational level, most people with student loan debt belong to lowest 25% for net worth percentiles. However, for those who identified as ‘black’, those who are in 75th percentile or higher actually compose a sizeable part of the student loan debt. This is not seen in other races. The above visualization shows that based on which net worth percentile the person belongs to, what race he/she is, and amount of education he/she received, one has different student loan amounts.
But why do people go for higher education? Does higher education mean you have more income? Is higher education related with increase in assets?
4. Does Higher Education Make You Rich? Or Do Wealthy People Go for Higher Education?
One important point from the above bar graph is that the richest 10% do not have that much student loan debt. I wanted to look into this further and see if wealth indeed influences student loan debt. If this is true, than student loan debt is what “keeps” the divisive wealth structure. I made a quick scatterplot.

The scatter plot shows that those in the highest 10% income percentile usually do not have any student loan debt. The graph also shows that there is no significant relationship with student loan debt amounts and income. The plot, however, displays that those with highest income are not with PhD degrees but actually with Master’s degrees. However, those with PhD generally have more income than other groups. Those who make it over 1 million dollars all have bachelor’s degree or higher education.
This made me wonder, what’s the relationship between income, asset, and education levels? Below, I created a scatterplot with linear regression lines to see this relationship.

The relationship between income and asset is expressed through regression line (gam method). The regression line shows that by education level, the relationship between asset and income is different. For those without high school diploma, even though they might have large assets, are unlikely to make a huge income. The line is almost flat. For those with high school diploma, the line is almost linear. For those with some college, the asset - income relationship is logarithmic. For those with bachelor’s degree, the asset - income relationship draws almost linear line. For those with master’s degree, the relationship is logarithmic as well. For those with doctorates degree or more, the line is also almost linear and has steeper slope than those with Bachelor’s or Master’s degrees.
All graphs show a positive relationship with asset and income. Asset and income play positive reinforcement to each other, and educational level is incorporated in the positive reinforcement of the two factors.
5. Conclusion
Education is indeed becoming more costly (relatively) for people; and the wealthier you are, the better off you are in getting an education without student loan debt. Also, since wealth is tightly related with race in the U.S., race also plays a part in understanding the student loan debt landscape.
Cost to higher education is so relative - those who come from less privileged backgrounds have to risk more to get the same education. Looking at student loan debt crisis in different perspectives helped me understand more about student loan debt problem in the U.S.

